Note : This is not a recommendation and I am not a registered analyst, these are just data points and an assessment of the positives and negatives from a longer term point of view.
Nifty Weekly
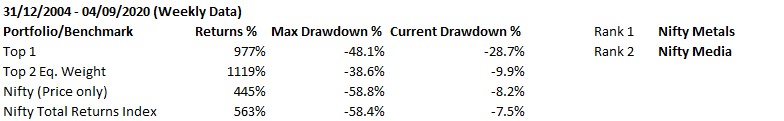
Chart 1. Strategy based on Nifty TRI
– is in buy mode and I am in Nifty-bees. Bond strategy is also in buy mode and
I am holding a 10Y bond fund. Allocation and other stats/details in the chart
below.
Note: Till March/April for the equities component I was using 2 different strategies but decided to stick to just 1 later on. Due to that the drawdown is a bit larger than if I was just using 1 equities strategy from the start.
For 1st chart If Green line under the Nifty and Bond Indices charts is up means buy mode and green line at 0 means exit mode.


Chart 2 Nifty total returns/10 year Bond index ratio is above its 40-week MA. Indicating longer term outperformance of Nifty vs Bonds.

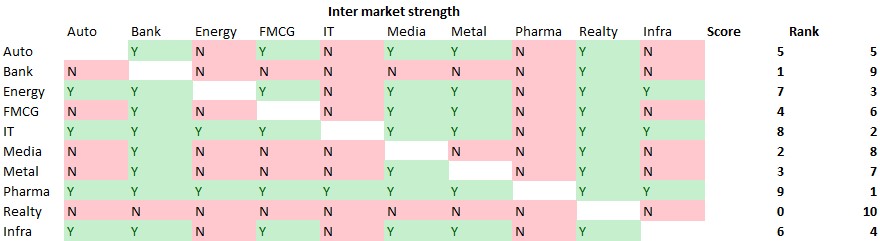
Chart 3 Longer term intermarket strength is in Autos, IT & Pharma. With Realty and Banks at the bottom.

Chart 4 9 of the broader indices are above their respective 40-week MA, and 8 of the sector indices are above its respective 40-week MA.

Chart
5 Avg. & Median distance of all sectors from their 52-week closing high is -12%
and -5%.